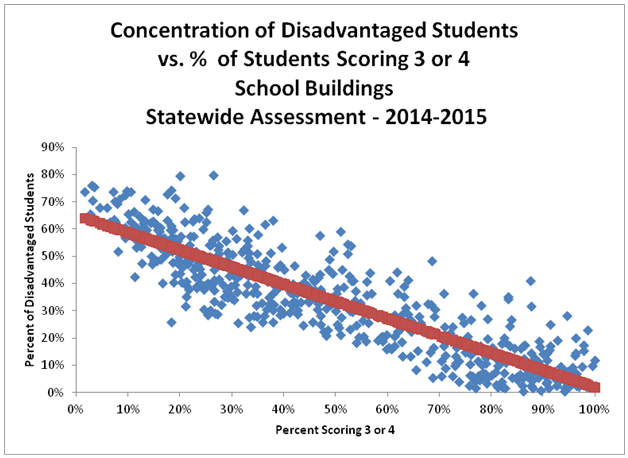
A few months ago, I wrote about the link between economic disadvantage and poor student performance. I looked at the performance of students on the State’s annual student assessment for grades 3 to 8, and found that the percentage of economically disadvantaged students in schools and school districts accounted for about three quarters of the difference in performance.

The data showed that a ten percent increase in students who were economically disadvantaged was associated with a six percent decrease in performance on the statewide assessment.
The New York Times, on April 29, published an article “Money, Race and Success: How Your School District Compares” that reports on a study that was based on national level data from the National Assessment of Educational Progress. The article points out that:
“We’ve long known of the persistent and troublesome academic gap between white students and their black and Hispanic peers in public schools.
We’ve long understood the primary reason, too: A higher proportion of black and Hispanic children come from poor families. A new analysis of reading and math test score data from across the country confirms just how much socioeconomic conditions matter.
Children in the school districts with the highest concentrations of poverty score an average of more than four grade levels below children in the richest districts.”
The data for the analysis comes from “The Geography of Racial/Ethnic Test Score Gaps” by Sean F. Reardon, Demetra Kalogrides and Kenneth Shores of Stanford.
In “School Segregation and Student Performance Gaps,” Reardon argues:
“Although it is clear that racial segregation is linked to academic achievement gaps, the mechanisms underlying this link have been debated since Coleman published his eponymous 1966 report. In this paper, I examine sixteen distinct measures of segregation to determine which is most strongly associated with academic achievement gaps. I find very clear evidence that one aspect of segregation in particular—the disparity in average school poverty rates between white and black students’ schools—is consistently the single most powerful correlate of achievement gaps, a pattern that holds in both bivariate and multivariate analyses.”
My own research showed that upstate cities have increasingly high poverty rates – in Syracuse and Rochester, for example, more than 50% of children under 18 live in poverty, and that minority group members living in upstate cities have far lower median incomes than white city residents or of white suburban residents.
| Median Family Income – 2014 | |||
| Upstate Cities | |||
| Black | Hispanic | White | |
| Albany | $39,077 | $29,268 | $84,422 |
| Buffalo | $29,155 | $21,803 | $55,516 |
| Rochester | $28,752 | $23,717 | $56,178 |
| Utica | $22,975 | $18,149 | $51,043 |
| Syracuse | $27,902 | $23,438 | $57,246 |
| Troy | $21,563 | $20,061 | $60,843 |
| Schenectady | $27,338 | $25,111 | $62,818 |
| Median Family Income – 2014 | |||
| Outside Cities | |||
| Black | Hispanic | White | |
| Albany | $67,400 | $78,594 | $91,693 |
| Buffalo | $39,001 | $44,463 | $77,996 |
| Rochester | $44,716 | $44,179 | $81,432 |
| Utica | $50,785 | $34,792 | $70,457 |
| Syracuse | $48,187 | $57,778 | $80,714 |
| Troy | $47,521 | $67,381 | $84,992 |
| Schenectady | $65,062 | $52,505 | $88,674 |
Median family incomes for blacks in most upstate cities were between $20,000 and $30,000 in 2013, while white families in suburbs around most upstate cities had median incomes of between $80,000 and $90,000.
The increasing separation of residents of upstate and suburbs by income is one of the most dramatic changes in the past half century in the way upstate residents live. In 1969, 14.2% of the residents of the City of Rochester, and 14.1% of the residents of Syracuse lived in poverty, compared with 11.1% for New York State as a whole. By 2013, 33.9% of Rochester residents lived in poverty, while in Syracuse, 36.5% lived in poverty. The poverty rate for New York State was 15.6%. So, New York State saw in increase in the percentage of residents living in poverty of 4.5%, while residents of Rochester had an increase of 19.7%, and 25.4%.
| Percentage of Residents Living in Poverty | ||||
| 1969 | 1989 | 1999 | 2013 | |
| Albany | 14.2% | N/A | 21.5% | 25.3% |
| Buffalo | 15.2% | 25.6% | 26.6% | 31.4% |
| Rochester | 12.4% | 23.5% | 25.9% | 33.9% |
| Syracuse | 14.1% | 22.7% | 27.3% | 36.5% |
| Schenectady | N/A | N/A | 20.8% | 24.8% |
| Troy | N/A | N/A | 19.1% | 27.3% |
| Utica | N/A | N/A | 24.5% | 31.7% |
| New York State | 11.1% | 13.0% | 14.6% | 15.6% |
(Data for cities with populations of less than 100,000 were not available for years before 1999).
Recent studies, like the national study by Reardon and other Stanford researchers, show strong associations between the concentration of black and hispanic residents in areas with high concentrations of poverty and poor student performance.
Unless we address the factors that lead to the growth of concentrated poverty in upstate central cities, and the continued separation of white, hispanic and black residents in upstate metropolitan areas, how can we effectively combat the persistent economic differences between black, Hispanic and white residents of upstate metropolitan areas, and the cycle of intergenerational poverty?