This research is a case study of employment challenges facing the Rochester Metropolitan area and the Finger Lakes region, and an analysis of the region’s strategic economic development plans and reports, developed in response to Governor Cuomo’s challenge to regions seeking economic development funding. While the report finds reasons why the region’s recent weak economic growth may improve, there are real concerns about the focus of its strategic economic development plans, and the absence of meaningful outcome/impact measurement and analysis.
Employment History
The Rochester area, among all the metropolitan areas in New York State, was historically most dependent on a few large manufacturing employers. Rochester companies like Kodak and Xerox were industry leaders that pioneered dominant imaging technologies in the 20th Century. The 2011 Finger Lakes Strategic Plan[1] reported that in 1983, Eastman Kodak had 60,400 employees in the region, and that “Kodak, Xerox, Bausch + Lomb, and General Motors employed nearly one fifth of the local workforce and indirectly had an impact on half of the region’s economy.” Today, according to Greater Rochester Enterprise,[2] Kodak employs 1,750, and Bausch and Lomb 985, while Xerox, according to the Rochester Democrat and Chronicle, employs 3,400.[3] General Motors employment in Rochester is 880.[4] Together, these companies now account for about 1% of regional employment.
Over the 47 years between 1970 and 2017, manufacturing employment in the Rochester MSA declined by 63% – from 152,511 to 56,546. The number of manufacturing jobs decreased in every decade, except the 1970-1980 decade. In 2017, 11% of Rochester MSA employment was in manufacturing industries, compared with 10% nationally.

The presence of large manufacturers in the 20th Century was good for employee incomes as well.[5] In 1970, average worker earnings were 12% higher than the national average. Because of the shift of employment from manufacturing to lower paying service sector occupations, Rochester area average worker earnings in 2016 were 8% lower than the nation.[6]

Like other rust belt areas, and neighboring Buffalo-Niagara Falls and Syracuse, Rochester’s employment growth since 2000 has been nearly non-existent. Rochester area employment grew by less than one percent by 2017, while Buffalo grew 1.4%, and Syracuse lost 2%.[7] Employment growth for the nation was 12% during the period.

Manufacturing employment declined substantially between 2000 and 2017 in the United States, upstate New York and the Rust Belt. In upstate New York, Rochester and Syracuse were most affected, each losing more than 40% during the period. Buffalo lost more than 35% of its manufacturing jobs. These locations and most rust belt metros lost greater percentages of manufacturing jobs than the United States, which lost 28%.
Automobile manufacturing industries experienced a sharp employment decline with the bankruptcies of GM and Chrysler in 2009. But, the federal bailout led to a substantial increase in employment after that. As a result, automobile manufacturing employment grew by 25% between 2010 and 2016, compared with 5% for other manufacturing industries. Metropolitan areas like Detroit, and others in Michigan and Ohio that have high concentrations of manufacturing had stronger manufacturing employment recoveries than those in New York.
Since the recession of 2008-10, manufacturing employment in Rochester, Buffalo and Syracuse has seen smaller declines or has stabilized. Buffalo’s manufacturing employment has been stable for the past four years, while Syracuse has seen a rebound after losing New Venture Gear/Magna in 2012, and Rochester’s decline has slowed. In Rochester, continued job losses in chemical manufacturing (primarily Kodak) accounted for 4,402 jobs lost between 2010 and 2017.[8]

While manufacturing employment declined significantly after 2000, employment in other private sector industries continued to grow in Rochester, Buffalo, Niagara-Falls, other rust belt metropolitan areas and the nation. Nationally, private sector non-manufacturing employment grew by 19%, the Rochester MSA grew by 13%, Buffalo-Niagara Falls by 9.7% and Syracuse by 5.8%.
Overall, the Rochester MSA’s performance since 2000 is near the middle of the group of rust belt metropolitan areas, even though only Flint and Ann Arbor, Michigan and Youngstown, Ohio lost greater percentages of manufacturing employment. Rochester’s weak manufacturing performance was offset by relatively strong employment growth in non-manufacturing industries, compared to other rust belt metropolitan areas.
Industry Performance from 2010-2017
Industry Sectors

Most service industries in the Rochester MSA saw growth between 2010 and 2017. Employment in health care and social assistance increased by more than 8,000, professional and technical services grew by 3,861 and educational services increased by 3,250. Nine industry sectors had employment growth of more than 10%. Industry sectors with significant employment decreases were management of companies and enterprises, losing 1,148, Information, losing 1,318 and manufacturing, losing 4,165.
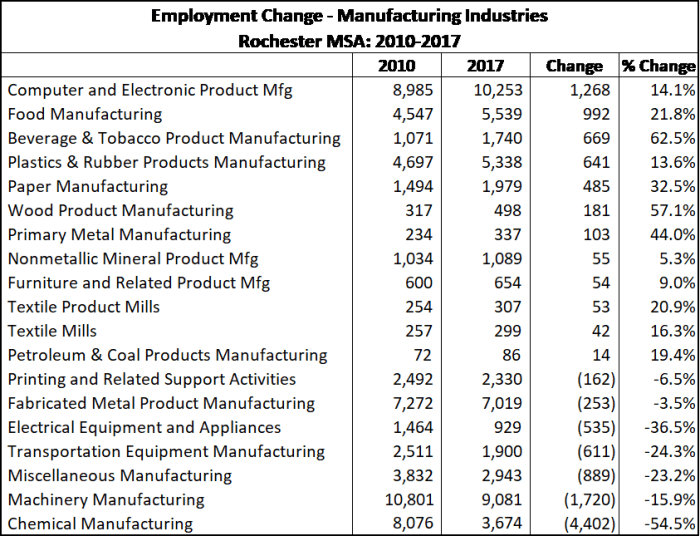
Manufacturing losses were concentrated in two industries – chemical manufacturing, largely Kodak, which lost 4,402 jobs between 2010 and 2017, and machinery manufacturing, which lost 1,720. The losses in chemical manufacturing were larger than the overall employment losses in manufacturing.
The performance of industries within the manufacturing sector varied. The region saw significant employment growth in computer and electronic product manufacturing (1,268), and two food related industries – food manufacturing and beverage and tobacco product manufacturing (these industries grew by 1,661 employees). But, other manufacturing industries each lost more than 500 employees: machinery manufacturing, chemical manufacturing, miscellaneous manufacturing, transportation equipment manufacturing, and electrical equipment and appliances.
Industries with Largest Employment Gains

The industry showing the largest employment growth (5,453) in the Rochester area between 2010 and 2017 was professional and technical services. Employment within the industry sector was primarily in four sub-sectors: engineering services, information technology services, management, scientific, and technical consulting services and scientific research and development services.
Education and health related industries, so-called “eds and meds” also had relatively large employment growth. Hospital employment grew by 4,445 (18%) while educational services employment grew by 3,250 (13%). Nursing and residential care facilities and ambulatory health care services each grew by more than 1,500 employees. It should be noted that a large portion of the growth in employment in the health care industries is from health care use by area residents, not from service users from outside the region.
Fast Growing Companies

The Rochester metropolitan area had 22 companies on the Inc. 5000 list of fastest growing privately held companies for 2017. The number of companies is 34% higher than would be expected from the area’s population. Twenty of the Inc. 5000 growing companies in the area were service businesses, two were manufacturers. Information technology services, particularly software services, was about one-third of the total, suggesting that the area has potential strength in this industry.
Finger Lakes Regional Economic Development Strategy
In 2011, Governor Andrew Cuomo restructured the delivery of economic development assistance to create a formal role for regional economic development councils in the decision-making process. The regional economic development awards temporarily replaced the process of state legislative grant-making though so-called “member items.”[9] That process required local organizations to request funding from individual state legislators. Funding was allocated by party leaders within the legislature. The new, executive branch-controlled process involves regional council members in the decision-making process, though the project scoring system allocates 80% of points to the state agencies administering projects, and only 20% to the regional councils.
As a part of the restructuring, in 2011 regions developed strategic plans. The 2011 guidance document, “A New State Strategy for Economic Growth” required public involvement, an assessment of current conditions, issues and opportunities, creation of a vision statement, development of strategies and implementation agendas and monitoring and evaluation of effectiveness.[10]
In 2015, Governor Cuomo created a regional competition for $1.5 billion of state funding, with $500,000,000 awarded to each of three regions. The purpose was to “create and maintain high-paying permanent private sector jobs and to lure private sector investments in amounts that are significant to the region.”[11] The initiative required regional applicants to develop transformative regional strategies to create significant employment and income growth. The Finger Lakes Regional Economic Development Council, along with Central New York and the Southern Tier received funding through the 2015 round.
The Finger Lakes 2017 Progress report describes the region’s strategies,
- “Three industry clusters, or pillars, that will act as the core drivers of job and output growth: (1) Optics, Photonics, and Imaging (OPI); (2) Agriculture and Food Production; and (3) Next Generation Manufacturing and Technology.
- Three core enablers that will facilitate economic growth within the key pillar industries: (1) Pathways to Prosperity: Workforce Development; (2) Entrepreneurship and Development; and (3) Higher Education, Research, & Healthcare.
- And four foundational strategies that will support the pillar and enabler strategies enhance the region’s quality of life and help the region attract and retain jobs: (1) Global NY; (2) Tourism & Arts; (3) Infrastructure & Transportation; and (4) Sustainability.”[12]


Although some funding through the regional strategies involves traditional economic development assistance to business such as capital projects and worker training, most of the region’s effort is focused on developing broad based initiatives in support of economic growth – ranging from support for industry related research and manufacturing process improvements to entrepreneurial assistance, institutional capacity for workforce development and civic improvements.
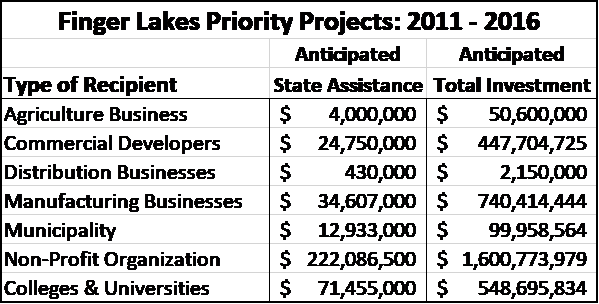
Only 17% of regional “priority project” grants – projects designated by the Finger Lakes Regional Economic Development Council as important elements of its strategic plan went to businesses. Most grants were given to non-profit organizations (60%), followed by universities and colleges (19%).
Analysis

At the outset it must be acknowledged that the Rochester metropolitan area’s economic performance since 2011 continues to be weak. In fact, the Rochester MSA, along with Buffalo and Syracuse, had less employment growth between 2011 and 2018 than rust belt metropolitan areas in Ohio and Michigan, except for Youngstown.[13] Also of concern is the difference in average wages between growing and declining industries. The average wage in growing industries in the Rochester MSA was $45,752 in 2017, while in industries with declining employment it was $53,786.[14]
The regional strategies are works in progress. Many of the projects initiated through the regional strategy have not yet been completed. But, if the Governor’s approach is to have significant employment benefits, they are yet to be realized.
In this section, I examine strengths and weaknesses in the Finger Lakes Regional economic development strategy and in the overall strategic planning and implementation process as implemented by New York State.
Industry Targeting

The 2017 Finger Lakes Progress Report states that “Three industry clusters, or pillars, that will act as the core drivers of job and output growth: (1) Optics, Photonics, and Imaging (OPI); (2) Agriculture and Food Production; and (3) Next Generation Manufacturing and Technology.”
Much of the region’s funding reflected its stated priorities. Photonics/Optics and Imaging received the largest amount of funding, $148,155,000 through 2016.[15] $147,000,000 was granted to the AIM photonics facility. Advanced manufacturing projects received the second largest amount – $69,457,000. Higher Education, Research and Health Care received $39,498,000
The Finger Lakes regional strategies between 2011 and 2016 supported several of the region’s fast-growing industries, particularly education and research. But, the emphasis overall in the strategic plans was on support of manufacturing related initiatives. 59% of regional funding went to advanced manufacturing and optics, photonics and imaging. Manufacturing is important to the Finger Lakes economy – average wages are high, and the region benefits from the income that results from the sale of manufactured products outside it. Consequently, regional efforts to help local manufacturers improve their competitive position should be key elements of the region’s employment retention strategy.
But, to identify next generation manufacturing and optics, photonics and imaging as two of the region’s three pillars driving job and output growth is unrealistic given the weakness of the area’s (and the nation’s) manufacturing performance in the past forty years. Though it is true that the Finger Lakes region is far less dependent than it was on a few large manufacturers like Kodak and Xerox, without the employment losses at those businesses, the region’s manufacturing employment growth during the recovery since 2010, like that of the nation, continues to be slow, and has lagged service sector growth. Manufacturing, including photonics, optics and imaging may grow, but because of its size and long-term growth, the fate of the region’s service sector is most important to future job creation.
In one significant way, the practice of grant making differs from the conception of the 2011 and 2015 strategic plans. Higher education and health care received about 11% of all funding – nearly $40 million. The plans view higher education and research as enablers – ways to develop the workforce to encourage employment growth in photonics/optics/imaging, advanced manufacturing and technology and agriculture/food processing. But, in fact, higher education and research are among the region’s largest industries and are also among those that have shown the most employment growth since 2010. Future planning efforts could benefit if they viewed growing traded service industries, including higher education and research and professional and technical services as employment drivers.
Optics, Photonics and Imaging
Optics, photonics and imaging is by far the largest manufacturing initiative in the Finger Lakes strategy. Greater Rochester Enterprise lists optics, photonics and imaging companies in the greater Rochester region. Companies on the list in related industries employed about 11,000 workers in the region in 2018.[16] Because the industry grouping contains Kodak and Xerox, employment has declined substantially over the past 40 years. To support future industry growth, the Finger Lakes region has made substantial efforts to support photonics initiatives at universities and other research and development institutions.
The most significant funding initiative through the regional strategies has been the American Institute for Manufacturing Integrated Photonics partnership. The AIM Photonics initiative is a $600 million public-private partnership that will receive $250 million of state support and $110 million from the Federal Government. The initiative is the region’s largest single bet for future employment growth.
The largest portion of AIM Photonics Initiative funding in the region – $147 million – went to create a photonics test, assembly and packaging facility in Rochester for industry partners. The objective of the effort is “invest in nurturing start-ups, enable small businesses and attract large enterprises” in order to “create thousands of jobs.”[19] The Finger Lakes regional strategy includes some significant efforts to support entrepreneurs and small businesses in the field.
To attract major industry companies to build large manufacturing plants, the region must develop industry intelligence, relationships with key industry players and build a long-term marketing campaign. In addition, appropriate sites for manufacturing facilities should be evaluated, permitted and basic site infrastructure development should be undertaken. Finally, attracting such a facility would require a large grant from New York State. Even so, because there is intense competition for major manufacturing plants, because electronics manufacturing has largely moved off-shore, and because the region does not have growing major regionally based stakeholders in photonics, success could be elusive.
A Strategic Plan, or a Strategic Planning and Implementation Process?
Strategic plans are of no real value if they do not guide actions, effectively measure outcomes against goals, and use knowledge gained in the implementation process to guide future action. Though the 2011 guidance for regional strategic plans required “monitoring and evaluation of effectiveness,”[20] regional plans have focused primarily on describing the funding status of projects, rather than outcomes.
Finger Lakes 2017 Annual Report – Progress
The 2017 Finger Lakes Progress Report section titled “Progress” begins, on pages 5-9 with a series of charts showing economic conditions in the region. Though the section is labelled “progress,” the charts do not examine the impacts of actions taken by the regional councils and the state in funding projects. Instead, we cannot know whether the conditions described are a result of regional initiatives or would have occurred in their absence.
The second section of the “Progress” section is a listing of funded projects. In this section, projects are identified with the amount of state funding received, total project cost, and project status (i. e., progressing on schedule, complete, etc.)
The final section provides aggregated data about project funding and status. In this section, there is a table on page 17 labelled “job creation to date”. But the data is provided without information about its source. Does the table show the estimated number of jobs created and retained based on contractual commitments to the state or are they actual jobs as measured by Empire State Development in its post-funding employment compliance reports?[21] Equally important, the measures of actual or projected job creation and retention are not tied to specific goals, project categories, or projects. As a result, the chart is of no value in assessing progress against program or project goals.
Finger Lakes 2017 Annual Report –“Implementation Agenda”
The following section of the 2017 Annual Report labelled “Implementation Agenda” looks at specific regional strategies. The sections detail activities undertaken by regional entities in support of major initiatives. For example, the first portion of the section, “Workforce Development” explains how workforce development is delivered in the Finger Lakes region, describing the steps being taken to address the need to help workers acquire marketable job skills. The quantitative data provided shows intermediate program activity but does offers little information about how many workers were able to get jobs because of the assistance provided. Here is an example:
“In the past program year, the three workforce development boards
and their community partners have achieved a record of success in several areas. Collectively they:
-
- Hosted 125 recruitments and job fairs attended by 6,000 job seekers.
- Funded skills training for 800 workers and job seekers.
- Served 20,000 customers at their career centers throughout the region.
- Helped 14,700 job seekers find employment (latest data from the 2016 program year).
- Served more than 1,000 youth with employment and job readiness services.
- Hosted multiple special events and programs such as Finger Lakes Works with their Hands, Health Care Career Day,
- Rochester Work’s Criminal Justice Partnership, Agricultural Career Day, and del Lago Casino & Spa recruitment days.”[22]
The section then provides a number of vague assertions about program effectiveness.
“Employers are moving the Finger Lakes forward.
- Through initiatives such as the Young Adults Manufacturing & Training Employment Program (YAMTEP).
Economic developers are moving the Finger Lakes forward.
- In partnership with Monroe Community College, Monroe County is leading the charge to train the local workforce with the new LadderzUP program. The program recruits, trains, and places workers into the most in demand careers in the region.
Secondary educators are moving the Finger Lakes forward.
- The Hillside Work – Scholarship Connection has been a consistent beacon of hope for at risk youth in the region for thirty years.
- Students that fully participate in the program maintain employment and graduate at a rate of over 90%.
Post-secondary educators are moving the Finger Lakes forward.
- Rochester Institute of Technology (RIT) Electronic Assembly Training program trained 10 veterans and 10 dislocated workers in 20 days to enter the electronic assembly industry.
The community is moving the Finger Lakes forward.
- Catholic Family Center, Action for a Better Community, and Community Place of Greater Rochester have partnered to offer two adult mentoring programs to the community.”
The data provides no useful information to evaluate the effectiveness of the region’s workforce development efforts because it does not measure outcomes/impacts of specific programs or kinds of assistance, (i. e, how many training participants were able to secure employment in the field for which they received training). Given this, it isn’t possible to know how much impact the initiatives have had on worker skill deficits in the region or do any measurement of costs and benefits.
Another portion of the Implementation Agenda section, “Higher Education, Research, and Healthcare Work Team presents a series of charts described as performance indicators. Several of the charts[23] appear to show that the region is not meeting goals but offer no discussion of the data or how the region intends to address the failures. In other cases charts present data that is not relevant to the goal in the chart title. For example, The first chart presents “Goal 1 – increase enrollment” in regional colleges and universities:

The data shows that enrollments have declined by about 5,000 over the 2011-2015 period. Clearly, this goal is not being achieved. But, the text provides no discussion of this issue, or how it might be addressed. Instead, the reader is provided with six pages of project descriptions, like the one below. None of the items provide specific information about which priority goal is being addressed, what specific strategic goal related benefit is to be derived, or a status description showing progress to a specific goal. For example:


The Chart, “Goal 2: Increase R&D” similarly shows that R&D has been declining in the Finger Lakes Region since 2011. Again, no discussion of the data is presented, nor is a specific strategy to remedy the shortfall identified.

The chart labelled, “GOAL 4: Increase STEM Graduates” is supposed to show area progress in increasing the number of STEM (Science, Technology, Engineering and Mathematics Graduates), But, the chart doesn’t measure change in the area’s ranking, or in the number of STEM graduates over time. Even the static data that is presented doesn’t show which year the data is taken from.
Evidence Based Policy Implementation
The Governor’s regional planning and grant program could potentially provide a rich source of data for regional and state decision-makers to measure project impacts, evaluate what works and what doesn’t, and to use the information to guide future actions. The Evidence Based Policy Making Collective[24] provides useful guidance as to how an effective implementation and evaluation could work. The Collective argues for this process:
“Monitor program delivery
-
- To clearly define the key components of a program model and track the inputs, activities, outputs, and outcomes of program service delivery through process evaluation and performance management
- To check whether services are delivered as intended, in terms of both quantity and quality, and whether programs are meeting their goals
Use impact evaluation to measure program effectiveness
-
- The systematic collection of information about a program to identify (or estimate) the specific contribution of that program to intended outcomes
- That specific contribution, in the language of evaluators, is known as a program’s impact5…
A process by which measurable goals are specified, and relevant data is collected and evaluated is essential to understanding the real impacts of programs and to making informed decisions about program continuation or termination. Unfortunately, that process does not exist in the Governor’s regional planning and funding competitions.
Since State and regional decision-makers are operating in the dark about the specific contribution to the intended strategic outcomes of the projects that received more than $4 billion in funding provided by state taxpayers, to strengthen future decisions, much improved definitions of project goals and appropriate impact measures are absolutely necessary. If the Governor’s regional partnership initiative is to continue, it is imperative that the state mandate substantial improvements in data reporting, performance analysis and evaluation.
Conclusion
The Finger Lakes, since 2000, has been hard hit by the collapse of employment at several large manufacturers. Because relatively few jobs remain at these companies, the region has less concentrated risk of losing jobs at one or a few companies. At the same time, the Finger Lakes region has had faster service sector growth than other upstate metropolitan areas west of Albany-Schenectady-Troy, available data suggests a strong entrepreneurial culture, and strong knowledge-based industries, all of which could strengthen its future employment growth.
The region’s strategic economic development plans and annual reports are concerns, though. The plan has an unrealistic view of the potential for manufacturing employment, particularly optics, photonics and imaging, to create regional employment growth, while giving short shrift to those service industries that are growing.
Of equal concern is the total absence of any kind of outcome/impact measurement or program evaluation. This weakness is not unique to the Finger Lakes strategies and reports. Several regional economic development strategies and reports have the same weakness. For example, see the Central New York Region Report:
Given the $4 billion that has been spent of the regional economic development grant competitions, the Governor and legislature should mandate effective impact measurement and evaluation as a condition of participation in the next round of funding.
—————————————————————————————————
[1] “NEWYORK OPEN FOR BUSINESS – Seneca County CCE.” 14 Nov. 2011, http://senecacountycce.org/resources/finger-lakes-redc-strategic-plan. Accessed 20 Jun. 2018.
[2] “Top Optics, Imaging & Photonics Companies – Greater Rochester ….” http://www.rochesterbiz.com/Portals/0/Top%20Optics%2C%20Photonics%2C%20and%20Imaging%20Companies%20in%20the%20Greater%20Rochester%2C%20NY%20Region%2C%202018.pdf. Accessed 20 Jun. 2018.
[3] “Fate of local jobs uncertain after Xerox, Fujifilm announce merger.” 31 Jan. 2018, https://www.democratandchronicle.com/story/money/business/2018/01/31/fuji-xerox-fujifilm-merger-cost-savings-jeff-jacobson/1081916001/. Accessed 20 Jun. 2018.
[4] “GM Corporate Newsroom – United States – Company – GM Media Site.” 4 Jun. 2018, http://media.gm.com/media/us/en/gm/company_info/facilities/component-fac/rochester.html. Accessed 20 Jun. 2018.
[5] United States Department of Commerce, Bureau of Economic Analysis, Regional Economic Accounts, https://www.bea.gov/itable/iTable.cfm?ReqID=70&step=1#reqid=70&step=1&isuri=1
[6] Author’s calculations from BEA data.
[7] Department of Labor, Bureau of Labor Statistics, Current Employment Statistics. https://www.bls.gov/data/
[8] Source: U. S. Census Bureau, County Business Patterns.
[9] The practice of making grants directed by the legislature later returned, see: https://www.empirecenter.org/publications/inside-albanys-secretive-slush-fund/ and https://www.politico.com/states/new-york/albany/story/2015/10/partisan-spoils-persist-in-new-legislative-earmark-program-026317
[10]“A New State Government Approach to Economic Growth” https://regionalcouncils.ny.gov/sites/default/files/2017-12/2011-redc-guidebook.pdf
[11] “Competition Guidelines: New York Urban Revitalization Initiative, April 2015” https://regionalcouncils.ny.gov/sites/default/files/2017-12/2015-uri-guidebook.pdf
[12] Finger Lakes Progress Report 2017, p. 8. https://regionalcouncils.ny.gov/sites/default/files/2017-12/2017ProgressReportFingerLakes.pdf
[13] Department of Labor, Bureau of Labor Statistics, Current Employment Statistics. https://www.bls.gov/data/
[14] Employment change from 2010-2017.
[15] Most recent available data from 2017 Finger Lakes Progress Report, op cit.
[16][16] “Top Optics, Photonics and Imaging Companies in the Greater Rochester, NY Region, 2018” http://www.rochesterbiz.com/Portals/0/Top%20Optics%2C%20Photonics%2C%20and%20Imaging%20Companies%20in%20the%20Greater%20Rochester%2C%20NY%20Region%2C%202018.pdfyujg8hni6rthuj76i Number adjusted to reflect more recent Xerox employment from Rochester Democrat and Chronicle, op. cit.
[17] https://en.wikipedia.org/wiki/Photonics
[18] http://www.aimphotonics.com/what-is-integrated-photonics/
[19] “Finger Lakes 2015 Upstate Revitalization Initiative Plan,” https://regionalcouncils.ny.gov/sites/default/files/2017-12/2015-finger-lakes-uri-plan.pdf
[20] “A New State Government Approach to Economic Growth,” op. cit.
[21] See, for example, “2016 Annual Jobs Report on ESD’s Loan and Grant Programs,” https://esd.ny.gov/sites/default/files/2016-Annual-Jobs-Report-Final.pdf
[22] 2017 Finger Lakes Progress Report, p. 25.
[23] 2017 Finger Lakes Progress Report, p. 31
[24] https://www.evidencecollaborative.org/principles-evidence-based-policymaking
Excellent as always, John, and full of very fair and well merited criticism of this regional plan and its follow-up reports. Some minor comments.
(1) I actually *favor* viewing higher ed as a vehicle for achieving sectoral goals rather than as a sector to be built for its own sake. While I take your point that the decline in enrollments and research funding suggest the region is underperforming its “export” potential in eds & meds job, I find that universities are dollar-tropic institutions rather than strategic ones. If you give them broad license to ask for state money, without constraining them by that grant’s contributions to an industry/sectoral strategy, you’ll find you’re being hit up for funds they feel are more likely to make them competitive in the federal competition du jour. While that might have certain “export” benefits, it’s a very unstrategic use of funds.
(2) Regarding the regional decline in research funding. Your graph suggeests to me that the Finger Lakes were highly competitive in the years of the ARRA (ca. 2009-2010), when federal agencies like NSF and NIH were appropriated a “bump” in available research funding (because R&D is by definition shovel-ready). However, as those bumps tailed off, the Finger Lakes institutions failed to maintain their competitiveness. That’s troubling and indeed someone should be asking why. Since I’m pretty sure RIT has been increasing its federal funding, the weakness might reflect turmoil at UR, or possibly losses at Cornell’s experiment station at Geneva. I have not looked at the data, but could probably help you find what you need if you are interested.
(3) I’m not as pessimistic as you are on the prospects of employment in the optics and photonics (and advanced manufacturing) industries, for these reasons:
(a) It is true that certain things need to fall into place to recruit *large* photonics manufacturers, but I’m pretty sure that’s part of the plan for the STAMP park in between Rochester and Buffalo. While I’m not wild about that greenfield location from a sustainability standpoint, I believe Steve Hyde and other champions of it are thinking clearly and carefully about what needs to happen. Meanwhile the AIM testbed facilities ought to be a *huge* services-export engine. It’s well worth monitoring their contract revenue as the facilities spin up.
(b) Some advanced manufacturing jobs masquerade under the “professional and technical services” category while they are R&D-stage companies, and we may be undercounting. Remember that no one assigns NAICS codes to a company; the firms self-assign. You’re asked a broad sectoral question on the IRS application for a Tax ID, but not narrow industry. Usually, the first time a full NAICS code is selected is when the firm receives an Economic Census form from the Bureau. This may still be early in its life, while it is pursuing non-dilutive funding like SBIR, and it may self-classify under codes such as the 5417 Scientific Research and Development Services industry group. If they do start manufacturing a physical item, eventually someone, possibly a commercial data service, will reclassify or multiply classify the establishment, but there’s a lot, a lot of noise in the data for small companies.
(c) We do have one super-important stakeholder in optics and photonics. It’s inside the state, but outside the region. I’m referring to Corning, of course. I am positive they are deeply involved in the Finger Lakes optics and photonics resources that have been built with state or federal & state funding. They don’t let regional barriers inhibit them, just as sophisticated industrial companies outside the Southern Tier will travel to Alfred, if need be, to pick up its expertise in advanced ceramics. One downside of the system of regional councils is that no one has zoomed out to 50,000 feet and thought about inter-regional interactions, as I complained about in my own blog post on the rail transportation sector.
(4) Regarding the differences between Rochester, Buffalo and Syracuse. Rochester and Syracuse have lost the most manufacturing jobs, but of the three only Rochester sees itself as a high-tech center. That’s what made the job losses in Syracuse so much more devastating than in Rochester. What are we going to do around here now that Carrier is gone? It takes a while for a city like Syracuse to answer a question like that when they’ve been hit so hard. And it’s what has made the Governor’s investment in the Buffalo Billion completely understandable. Starting with a manufacturing economy hit not *quite* as hard, he’s investing in connecting those remaining manufacturing firms to an R&D-driven, high-tech future. It actually makes sense to me psychologically. Rochester certainly has the losses, but it also has the self-image to recover.
(5) Finally, understanding the differences between our upstate metros and the rest of the rust belt metros definitely calls for more work that I assume you are continuing to explore. I wonder if you’ve read the work of Harvard’s Gary Pisano and others on industrial ecosystems. It seems that when you lose so much manufacturing, you eventually lose the associated R&D, because companies often invest in R&D to solve problems raised by actually making stuff. We’ve seen this kind of disappointment repeatedly. When Carrier left Syracuse, UTC promised it would retain HVAC R&D in town, and while they may have kept a few jobs on the margin, this amounts to nothing compared with UTC corporate R&D in Connecticut. With GE leaving Erie, Pa., they’ve made the same promises, and I doubt them to the same degree. We need to understand this dynamic much, much better, and Corning would be high on my list to study.
Keep up these great analyses.
David – Many thanks for your insights.
A few comments – my notes about the higher education statistics presented by the Finger Lakes Partnership were intended to illustrate the fact that the data they presented wasn’t explained or associated with any analysis or action.
With regard to your comment about universities, I’d agree that there is a great likelihood that much of the funding in the regional strategic plan is unlikely to have any employment benefit. In fact, because the Finger Lakes regional report was a laundry list of projects, rather than a strategically driven analysis with clear statements of how projects would create jobs, along with realistic estimates of actual jobs impact, many of them may provide no real economic benefit. Having said that, helping colleges and universities maintain their competitive position is important to the region’s employment, simply because they are big employers that bring much money into the region.
With regard to photonics, I wanted to make two points. One, like any attempt to attract an industry to a region, this one faces substantial challenges. And, since the area isn’t home to any significant photonics companies, and faces sharp competition from low labor cost areas, it may be difficult to attract a major manufacturer. Second, having said that, they may succeed. But. even so, the cost of creating, for example 2,000 jobs, will be extremely high, and the opportunity costs associated with the attraction effort would be significant. So, I think the service sector is likely to offer more job creation potential because of its size and growth.